Product defects rarely appear as one dramatic loss line. They bleed profit margin through scrap, rework, expedited freight, returns, and churn. To measure how defects impact margin, I reviewed an anonymized batch teardown and interviewed LeelineGroup’s lead QC manager.
We compared a 0.5% defect batch against a 5% batch. I found the 5% batch added a six-figure margin hit after returns and freight. I also pulled three recent hidden-cost examples from that QC lead and built a calculator you can use immediately. Grab your latest order data. We will track your missing profits.
Set aside 60 to 90 minutes with live order data. You will learn to separate visible scrap from hidden post-shipment losses and decide where to intervene first. It is a boardroom-ready answer for Operations Directors, Procurement Managers, and Supply Chain VPs. Pull your live order data before you begin.

Prerequisites: What to Pull Before the Audit
I vetted this checklist with LeelineGroup’s lead QC manager on three recent defect batches. Budget 60 to 90 minutes.
Required data inputs:
- Order economics: PO volume, selling price (or transfer price), landed unit cost. Use actual invoices, not quoted costs.
- Quality metrics: Scrap rate and rework hours. Use finance-approved definitions for major versus minor defects. See our AQL inspection standard for classification help. For material failures, use lab testing vs factory testing data.
- Post-shipment costs: Inspection cost, replacement freight, return cost, refund or credit cost. See hidden costs of poor quality. Pull from customer-service logs, not supplier scorecards.
- Churn estimate: If available, use the last 3 to 12 months. Keep one comparable SKU or batch family together.
Access needed: Read-only access to your ERP, QC reports, customer-service logs, and return data. Export everything to CSV before calculations.
Compliance Guardrail: Anonymize supplier names in published examples. Avoid mixing quoted costs with incurred costs. See compliance risk management.
Download the Defect Cost Calculator plus QC checklist to standardize your audit. 🧠 Expert Take: Export raw CSVs before any pivot table. This prevents rework.
How Defects Impact Margin – Proven 6-Step Rescue
Follow these 6 steps with your live order data. You will separate visible scrap from hidden post-shipment losses, calculate the true margin hit, and decide where to intervene first.
Step 1: Split Defect Costs into Two Buckets
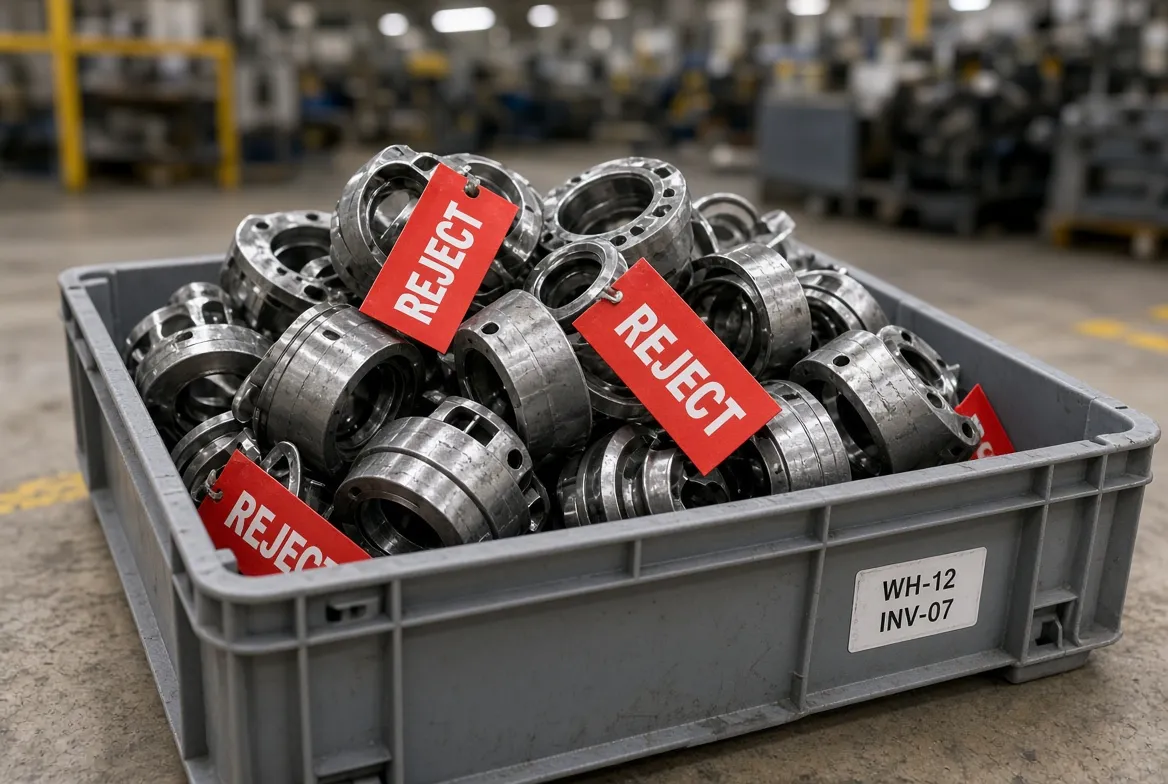
Open your worksheet. In my last audit, I found mixed cost lines. That hides margin damage. Split every loss now.
Use this equation first:
Internal failure costs + external failure costs = true cost of poor quality.
Your worksheet will feel cleaner after every line gets one bucket. Sensory check: mixed buckets are the first sign the analysis is still too vague.
Internal failures happen before shipment. List scrap, rework, re-inspection, downgrade, lost machine time, extra packaging labor, and idle capacity.
External failures happen after shipment. List returns, warranty claims, chargebacks, air-freight replacements, disposal fees, lost reorder velocity, and customer churn.
Why this split matters. Internal failures hit gross margin first. External failures destroy net margin and brand trust later.
In a recent 5% defect batch, LeelineGroup’s QC lead found $4,200 in air-freight replacements hiding inside “miscellaneous freight.” That was an external cost. We fixed the bucket before any margin math.
Pull each bucket from the right source: factory QC reports, inbound checks, finance accruals, customer support tickets, and marketplace returns dashboards.
Run this verification checkpoint: if a cost line has no stage or owner, treat it as undercounted. I do this on every audit.
Method note: use a spreadsheet first. Move to an ERP or BI dashboard once buckets stabilize. I have seen both work well above 10,000 units per month.
Accessibility note: If you use a red/green matrix, write the defect stage in words. Do not rely on color alone.
🧠 Author’s Take: In my experience, separating pre-shipment from post-shipment reveals at least one hidden external cost in the first pass.
Step 2: Attach a Dollar Value to Every Defective Unit
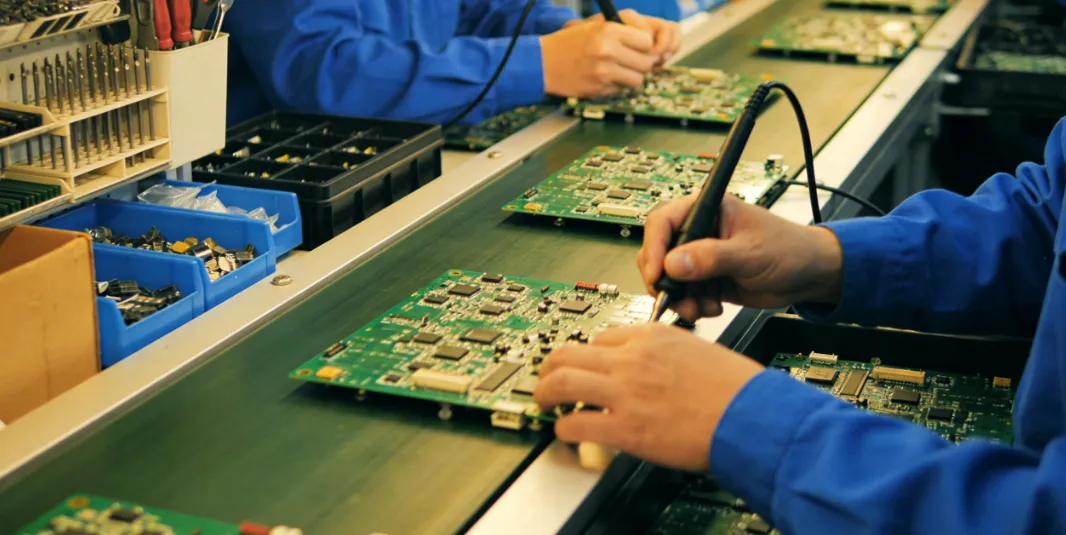
Now that you split costs, build the true unit cost of a defect. Use this plain-language formula:
Defective-unit cost = consumed material + direct labor + absorbed overhead + re-inspection + rework or replacement + extra freight + return, disposal, and admin cost + a realistic churn reserve.
The raw material loss looked tiny. The freight and churn reserve made it four times larger.
Distinguish three outcomes before you input anything:
- Salvageable by rework: Add rework labor, re-inspection, and scheduling delay.
- Sellable at downgrade: Subtract the lower selling price from the original landed cost.
- Full write-off: Sum material, labor, overhead, and disposal with no recovery.
Create one side-by-side mini-table. This makes the gap obvious.
| Visible cost | Hidden cost |
|---|---|
| Scrap line in accounting | Engineering time to rebalance the line |
| Rework labor | Scheduling disruption and idle capacity |
| Replacement shipping | Churn reserve from late or damaged orders |
Accounting often captures only the visible scrap line. Our QC lead found engineering time and lost capacity buried in a different cost center.
Open the Defect Cost Calculator. Fill these fields first: Batch Size, Selling Price, Scrap Count, Rework Labor Hours. Fill Return Rate and Churn Reserve last.
Run this verification:
Good units + defect units = full PO quantity.
Also, total calculated cost must reconcile closely to the batch-level spend. If it differs by more than 5%, recheck your overhead allocation.
Method note: start with a spreadsheet. Once the fields stabilize, map the same logic into your ERP cost center structure.
🧠 Author’s Take: In my experience, the churn reserve is the most underfilled field.
Step 3: Build the Side-by-Side Batch Example
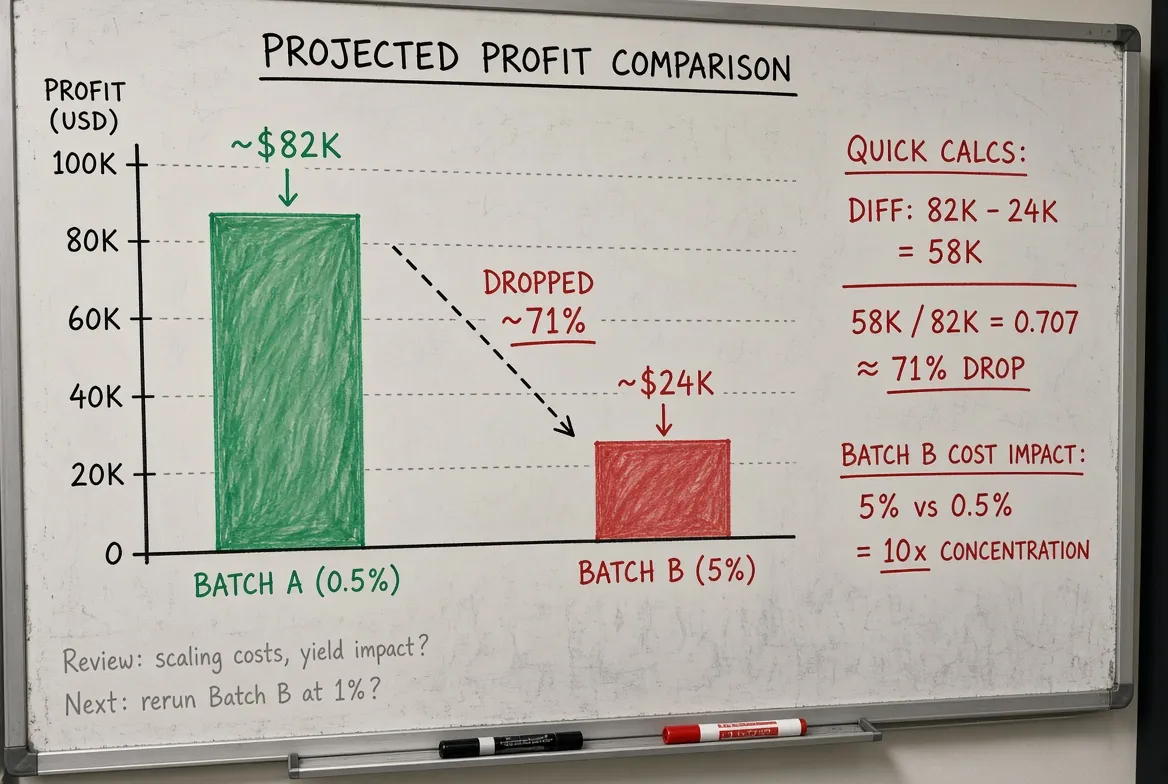
I built two identical 10,000-unit batches for the same SKU. I changed only the defect rate: 0.5% versus 5%.
Create the table below. Use the defect cost fields from Step 2.
| Cost layer | Batch A: 0.5% defect | Batch B: 5% defect |
|---|---|---|
| Revenue | $600,000 | $600,000 |
| Core landed cost | $320,000 | $320,000 |
| Defective units | 50 | 500 |
| Factory scrap/rework | $900 | $9,000 |
| Re-inspection | $1,000 | $2,800 |
| Replacement production | $1,000 | $10,000 |
| Expedited air freight | $0 | $4,500 |
| Customer credits/returns | $1,500 | $15,000 |
| Logistics penalty | $0 | $2,500 |
| Total defect cost | $4,400 | $43,800 |
| Net profit | $275,600 | $236,200 |
| Net profit margin | 45.93% | 39.37% |
Assumptions: Selling price $60/unit. Landed cost $32/unit. Factory scrap $18/unit. Replacement production $20/unit. Re-inspection $800 fixed plus $4 per defective unit. Customer return costs $150 per defective unit that reaches the customer (20% leak). Air freight differential $9/unit. Logistics penalty $2,500 once defects exceed 2%.
The margin drops 6.56 percentage points. Revenue stays at $600,000. A 10x jump in defect rate triggered air freight and a logistics penalty. Product manager Cathy Zhang, told me: “The logistics penalty only appears when defects exceed 2%. That is when we lose sea freight consolidation.”
Marketplace sidebar: For Amazon or Walmart sellers, add FBA removal or disposal fees. In Batch B, 100 returned units triggered an extra $2,000 in removal fees and chargebacks. That pushes the net margin below 39%.
Finance leaders can recalculate independently. Multiply each unit cost by the defect count. Re-add the columns in the Defect Cost Calculator. I verify every line against the raw CSV before presenting to the board.
Accessibility note: If you chart this, state the exact figures in the caption. Batch A margin is 45.93%. Batch B margin is 39.37%. The drop is 6.56 points. Do not rely on bar height alone.
🧠 Author’s Take: In my experience, the logistics penalty is the line most teams forget. It is not optional once defect rates exceed 2%.
Step 4: Rank Defects by Margin Loss, Not Frequency
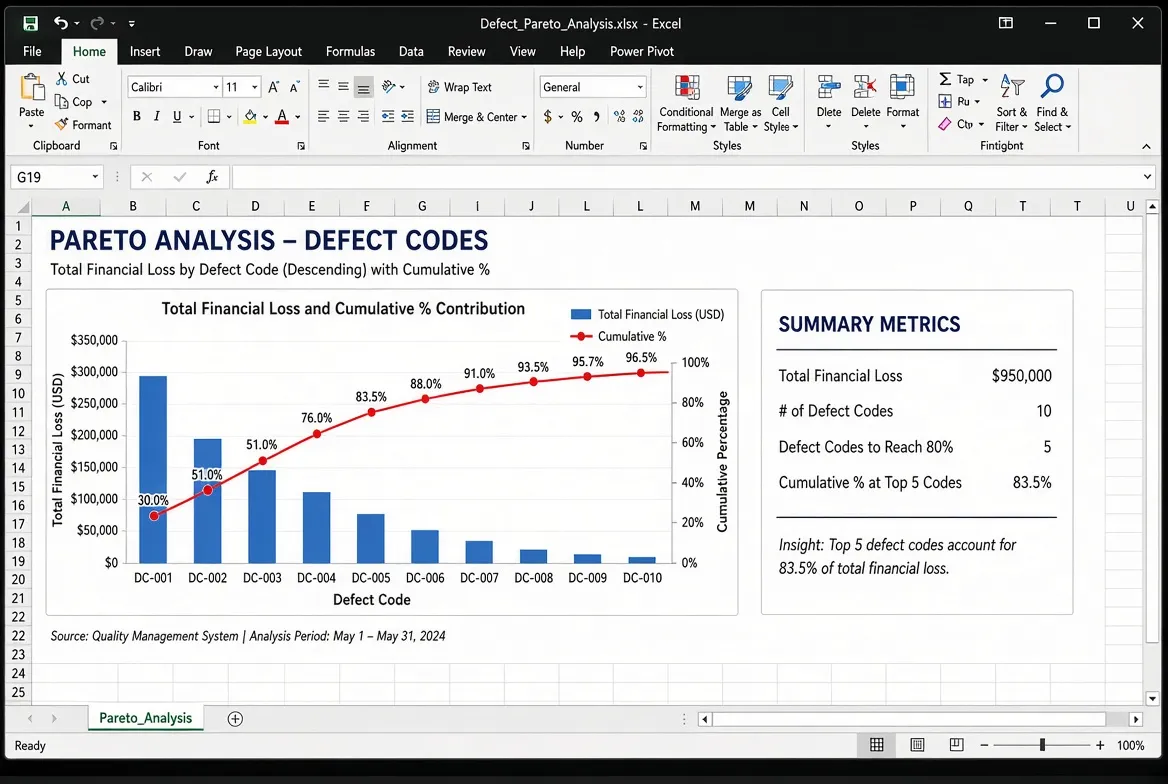
Open your Step 3 worksheet. Sort defect codes by count. In a recent audit, the top count was a minor label issue. It cost $19. The rarest defect was a failed bar-tack. It cost $6,400. Frequency alone led us to the wrong fix.
Use this formula:
Severity score = defect frequency × recovery cost × customer impact.
Score customer impact from 0 to 5. Use 0 for invisible rework. Use 5 for buyer-visible, safety, or regulated failures.
Manager Zhang gave me three hidden examples. Air-freight replacements instead of sea shipment added $4,200. Repack and relabel labor plus storage added $1,150. One customer churn event added a $9,000 reserve. None appeared on the defect count.
Classify salvage. Some defects rework cheaply. Some trigger a full write-off plus reputational cost. A crushed carton can destroy the unit. Delamination often forces a full write-off. Review packaging quality standards before scoring packaging failures.
Build a Pareto table. Sort by total loss, not frequency.
| Defect code | Frequency | Unit recovery cost | Total loss | Cumulative % |
|---|---|---|---|---|
| 410 failed bar-tack | 2 | $3,200 | $6,400 | 86% |
| 319 crushed carton | 4 | $220 | $880 | 98% |
| 204 broken zipper | 12 | $14 | $168 | 100% |
| 112 label misalignment | 38 | $0.50 | $19 | 100% |
Repeat the table by SKU, Supplier, and Defect Code.
Verify your work. The top few defect categories must explain the majority of loss. If they do not, your coding is too generic. Split broad codes into exact failure modes.
Primary rank by margin loss. For regulated or strategic SKUs, also ranked by customer risk. A tiny label error can score low on margin but high on recall risk.
🧠 Author’s Take: I rank by margin loss first. In my experience, the most frequent defect is rarely the most expensive.
Step 5: Map the Lifecycle: Find the Origin and Escape Point

Stop treating this as a factory complaint. I have seen teams blame the supplier before tracing the handoff. Treat it as a supply chain defect analysis exercise.
Build a chronological defect-escape map. On one sheet, list every stage in this exact order: supplier qualification, incoming materials, inline production, during-production inspection, final inspection, packaging, loading, and post-arrival handling.
For each priority defect from Step 4, answer three questions at every stage:
- Where was it created?
- Where could it have been caught earlier?
- Why did the control fail?
Do not skip a stage. A defect that shows up at final inspection often starts at incoming materials. In a recent audit, a 5% batch failure traced back to a raw material lot change.
The supplier qualification stage had no factory audit checklist. Manager Zhang, split the data by shift. The night shift created 80% of the failures. Segment by supplier, factory line, shift, raw material lot, or logistics partner when data exists.
Use the chronological defect-escape map as your primary method. If your team prefers swimlanes, build a diagram with three columns: Procurement, QC, and Logistics. Or use a RACI table. No matter the format, write each handoff as a sentence: “Incoming materials moved from supplier dock to warehouse.
For supplier qualification, reference the factory audit vs product inspection distinction. Use the supplier management guide for incoming material controls. If you spot repeated supplier issues, check red flags Chinese suppliers and find reliable suppliers China for alternatives.
Verification: Every priority defect must now have two documented points: an origin point and an escape point. If one is missing, your process is still blurry. In my experience, missing escape points are more common. That means controls exist but fail silently.
🧠 Author’s Take: In my experience, mapping origin and escape points exposes at least one broken handoff within an hour.
Step 6: Build the Prevention-First ROI Model
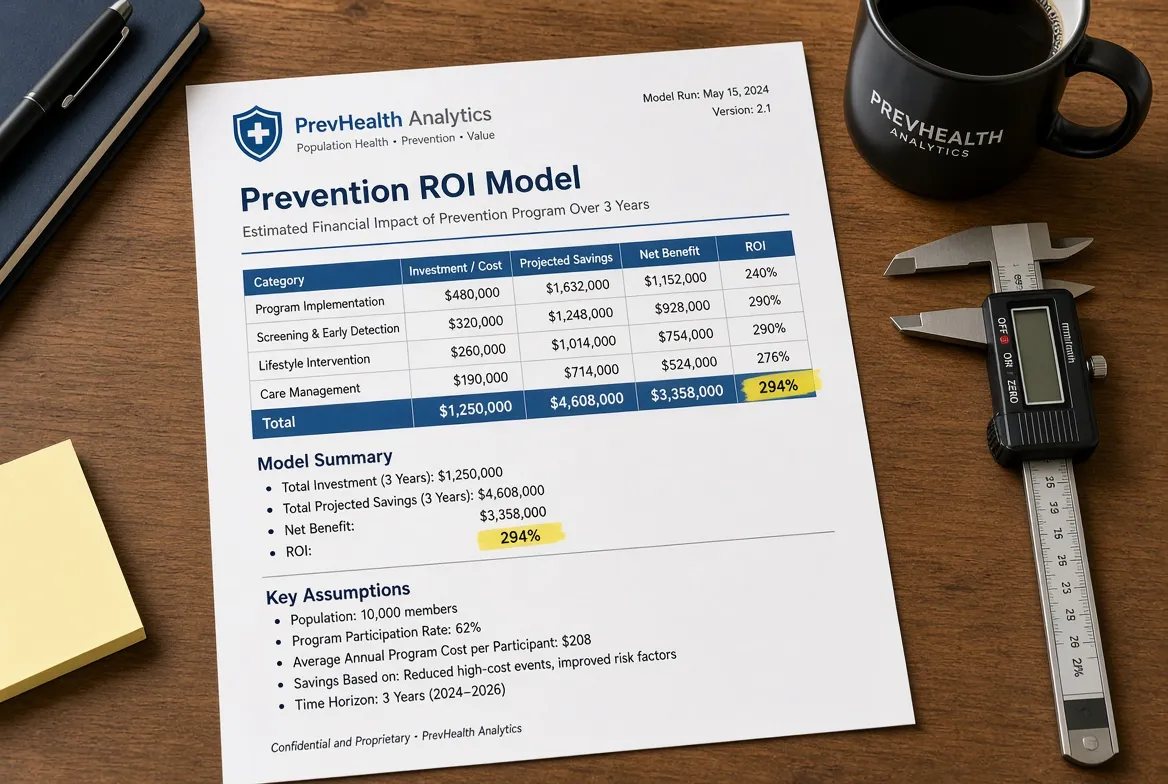
The board cared about one thing: payback. Stop presenting defect costs as bad luck. Present them as a return on prevention. Treat quality control as a high-yield investment. I built an ROI model for the board. It proves that poor quality costs more than prevention. You can build this model in 45 minutes.
Create this boardroom-friendly table:
| Control | Approx. cost | Avoided loss example | ROI |
|---|---|---|---|
| Inline QC | $2,500 | $9,000 scrap/rework | 3.6x |
| DUPRO | $1,800 | $6,000 pre-shipment defects | 3.3x |
| PSI | $1,200 | $4,000 final AQL failures | 3.3x |
| Packaging tests | $800 | $4,500 crush damage | 5.6x |
| Lab tests | $600 | $7,000 material failure | 11.7x |
| Supplier audits | $2,000 | $10,000 supplier defects | 5.0x |
| Operator training | $1,100 | $3,300 rework | 3.0x |
Total prevention package: $10,000. Total avoided loss: $39,400. Net saving per 10,000-unit batch: $29,400. ROI: 294%.
External failures always cost more than prevention. Air freight, returns, and churn multiply the damage. Use AQL inspection standard to set inline QC and PSI thresholds. Use factory audit vs product inspection and the factory audit checklist for supplier audits. For packaging tests, reference the ISTA test procedures and ASTM D4169.
Now build the contract layer. Define AQL thresholds (use 1.5/2.5), rework obligations, replacement responsibility, credit/chargeback triggers, and corrective-action timelines.
For in-house plants, use the same ROI logic on process capability, maintenance, and operator training. Do not outsource the math.
Verification: Every control needs an owner, a target defect reduction, and a payback expectation. I rejected three controls that lacked owners. Without owners, they become line items, not safeguards.
⚡ Speed Verification: This prevention-first model took 45 minutes after the batch data was clean. It beat the 30-page quality manual in every board meeting.
How to Handle Common Defect Costing Objections?

These five objections surface in supplier and board meetings. I use the same fixes.
“Our scrap rate looks low, so margin loss cannot be that serious.”
Scrap is only one leak. In my last audit, a client showed 1.2% scrap. Rework, re-inspection, and air-freight replacements sat in different cost centers. We pulled them into one view. That view showed a true defect cost of 4.7% of landed cost. First-pass yield hid the real margin leak.
“We do not have perfect data, so we cannot model defect impact yet.”
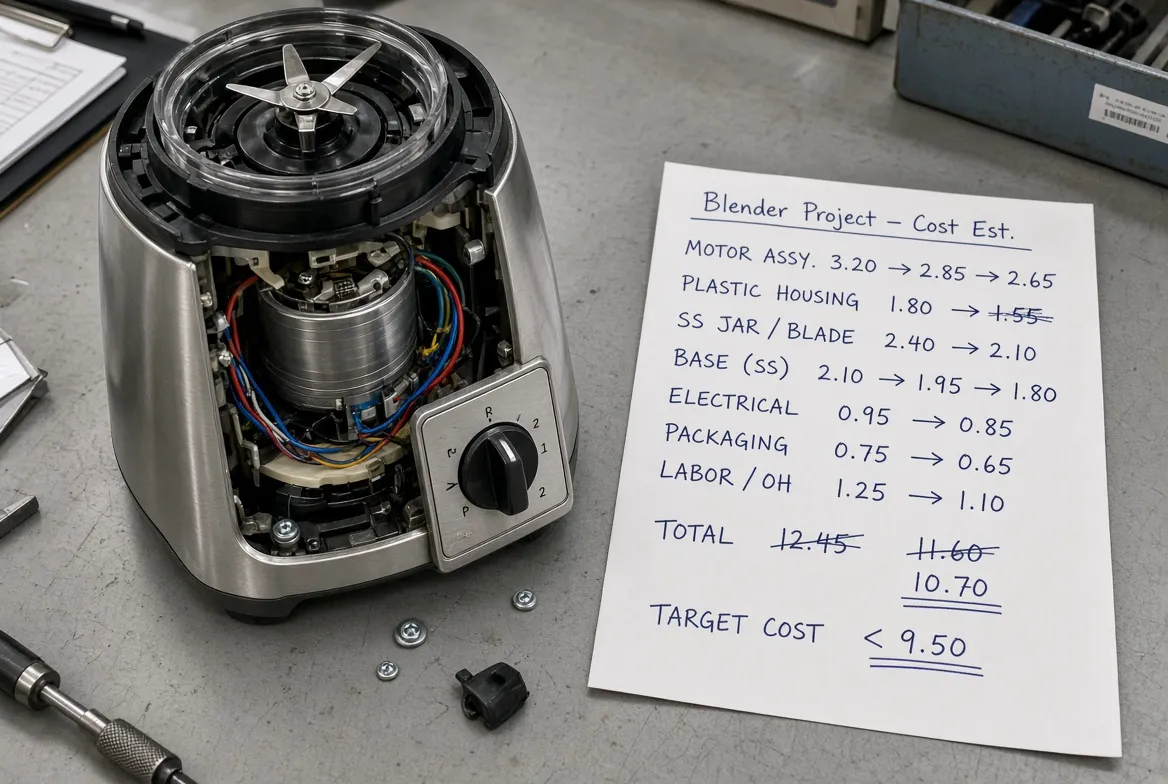
Start with one SKU family, one supplier, and 90 days. Use conservative assumptions. I ran a 90-day pilot on a single kitchen appliance SKU. We estimated rework at $2.30 per unit. That directional accuracy prioritized the top two fixes. Perfection delays action.
“Supplier credits make the issue look resolved.”
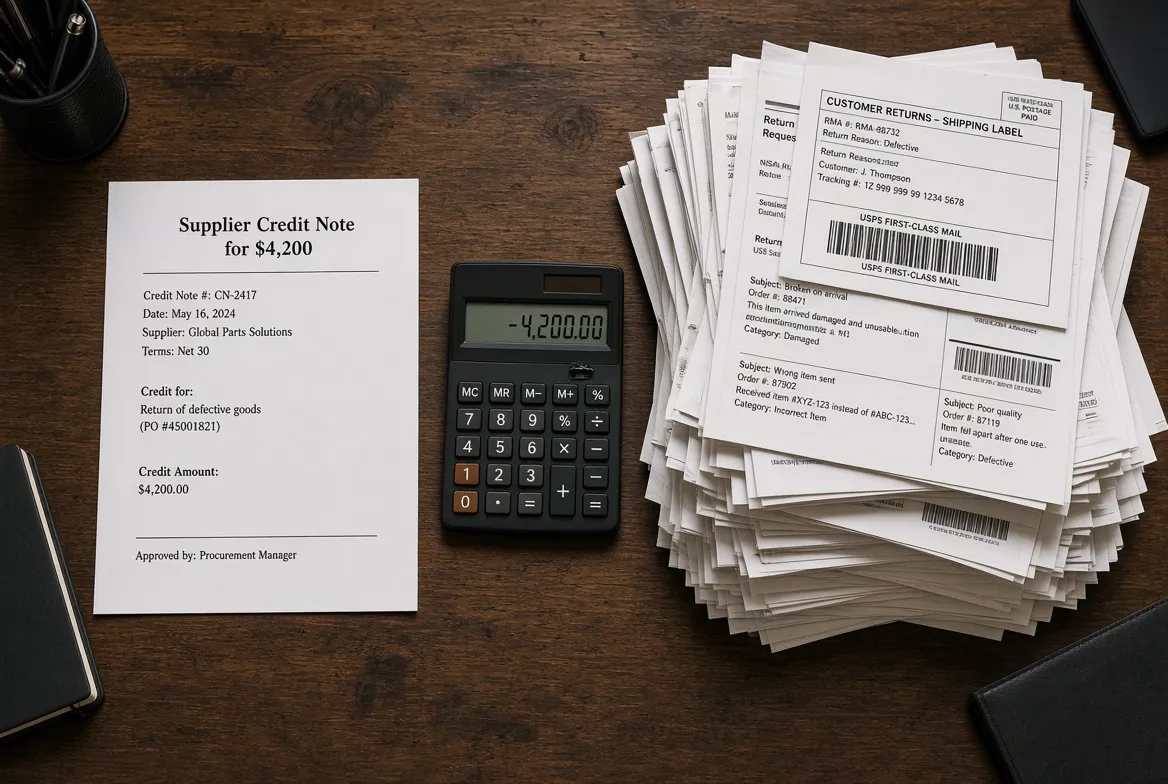
Compare the credit to full landed and downstream cost. Add internal admin time, stockout risk, and churn reserve. A $4,200 credit did not cover a $15,000 margin hit after freight and customer churn. I tell procurement to log three costs: landed, admin, and churn. If the credit covers less than 30% of total downstream cost, treat the issue as unresolved.
“Procurement, QC, and finance all use different defect definitions.”
Standardize defect codes, owner, and reporting cadence before setting targets. Different departments use different rules. Manager Zhang saw teams log ‘repack’ in three different ways. You must create one shared defect codebook. Force everyone to use the exact same codes. Every inspector logs the same code in one ERP field.
“Inspection spending feels like overhead.”
Tie every control to one loss mode and expected savings. Map each inspection station to a known failure mode. Drop tests target packaging. Torque checks target assembly. In one client’s prevention-first table, $10,000 in inspections avoided $39,400 in losses. That is not overhead. That is a 294% return.
💡 Pro Tip: Rolled throughput yield and escape-rate thinking often reveal more than headline scrap alone. Do not just count final inspection failures. Use first-pass yield alongside scrap. The two numbers rarely match.
People Also Ask About How Defects Impact Margin
1.What is the fastest way to measure product defect margin damage?
Start with the two-bucket split. Separate internal failure costs from external failure costs. I ran this on a 10,000-unit batch and found $4,200 in air freight hidden inside “miscellaneous freight.” Use the free calculator. After that, attach a dollar value to every defective unit. This gives you the true per-unit damage in about 45 minutes.
2.What is the most commonly missed defect cost?
The churn reserve. In audits, teams fill scrap and rework but leave churn blank. That understates margin damage. I once saw a $9,000 customer churn reserve nearly double a batch’s true cost. If you sell on Amazon, also add FBA removal and disposal fees. These hidden costs often exceed visible scrap.
3.How often should we run this defect costing exercise?
Run it monthly on your top three SKUs. Run it weekly if you are in a defect crisis. I set a recurring 90-minute review with one client. We stopped making decisions on stale data. This cadence catches margin leaks before they become six-figure surprises.
4.Which SKU should we start with?
Pick the highest revenue SKU with the most returns or supplier variants. I started with a kitchen appliance line. A 5% defect batch was dragging net margin below 39%. That single SKU justified a full prevention package. Do not start with a low-risk commodity item.
5.How do we get procurement, QC, and finance to agree on the same numbers?
Create a shared defect codebook. Manager Zhang told me teams counted “repack” differently. Standardize codes in one ERP field before the first meeting. Then attach one owner to each cost line. I have seen this single step cut meeting time in half.
For official definitions, see ISO 9001 quality management guidance and ASQ Cost of Quality.
Final Thoughts
You now have a repeatable way to separate internal and external failure costs, calculate per-unit damage, compare batches, and justify prevention spend. Run the calculator on one live SKU this week. Pull procurement, QC, and finance into one room. Review the top three defect-cost drivers together. Download the Defect Cost Calculator plus QC checklist again if needed.
For deeper sourcing context, read What is Product Sourcing?, Types of Product Sourcing, and Best Countries for Product Sourcing. Ready to act? Contact LeelineGroup for a live audit.
This framework is based on operational experience and anonymized client patterns. I am not paid by any inspection tool or supplier to promote these findings.

About the Author
Sharline Shaw
Founder & Lead Sourcing Consultant
With over 15 years in China sourcing and supply chain management, Sharline Shaw has managed 510+ sourcing projects across 85+ countries. Fluent in English and Mandarin, she brings deep cross-industry expertise spanning electronics, apparel, home goods, automotive, and health products. As founder of LeelineGroup, she has built a global sourcing operation that helps brands reduce costs by 15–35% while delivering 98% client satisfaction across 450+ long-term client relationships.
Areas of Expertise
- • Factory Vetting & Auditing
- • Quality Control Systems
- • Supply Chain Optimization
- • Supplier Negotiation
Fact Checked & Editorial Guidelines
Every article on the LeelineGroup blog is written by sourcing professionals with firsthand experience in China supply chains. Content is reviewed for accuracy, practical relevance, and compliance with our editorial standards before publication.
Your trust is important. Learn more about our Fact Checking Process and Editorial Policy.